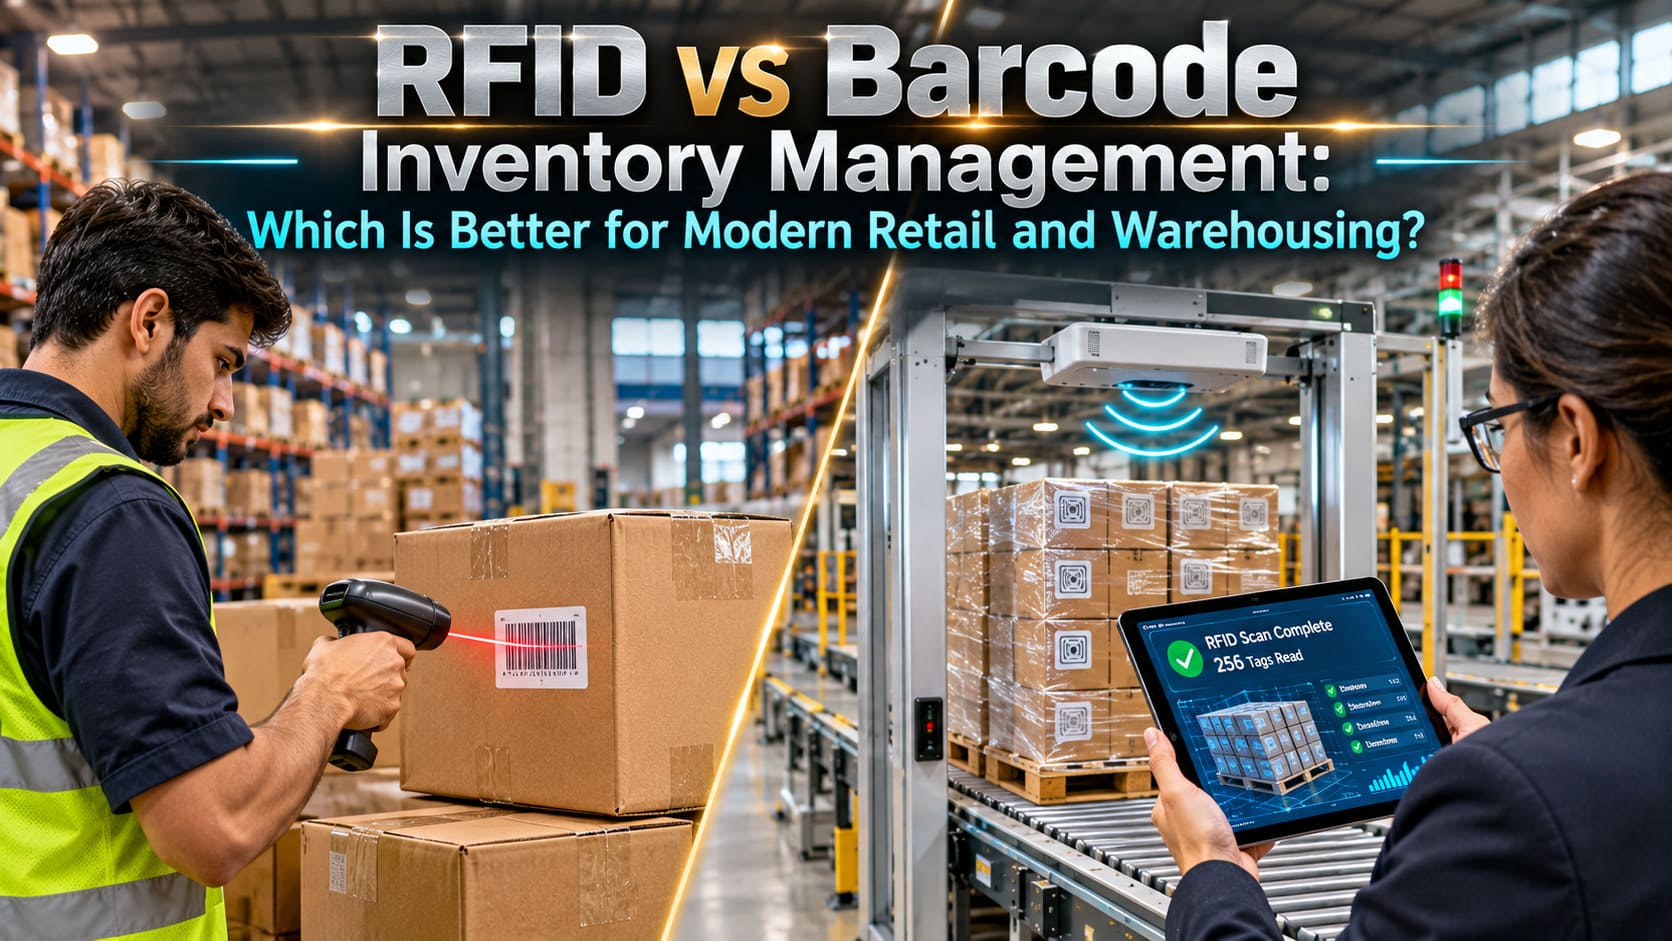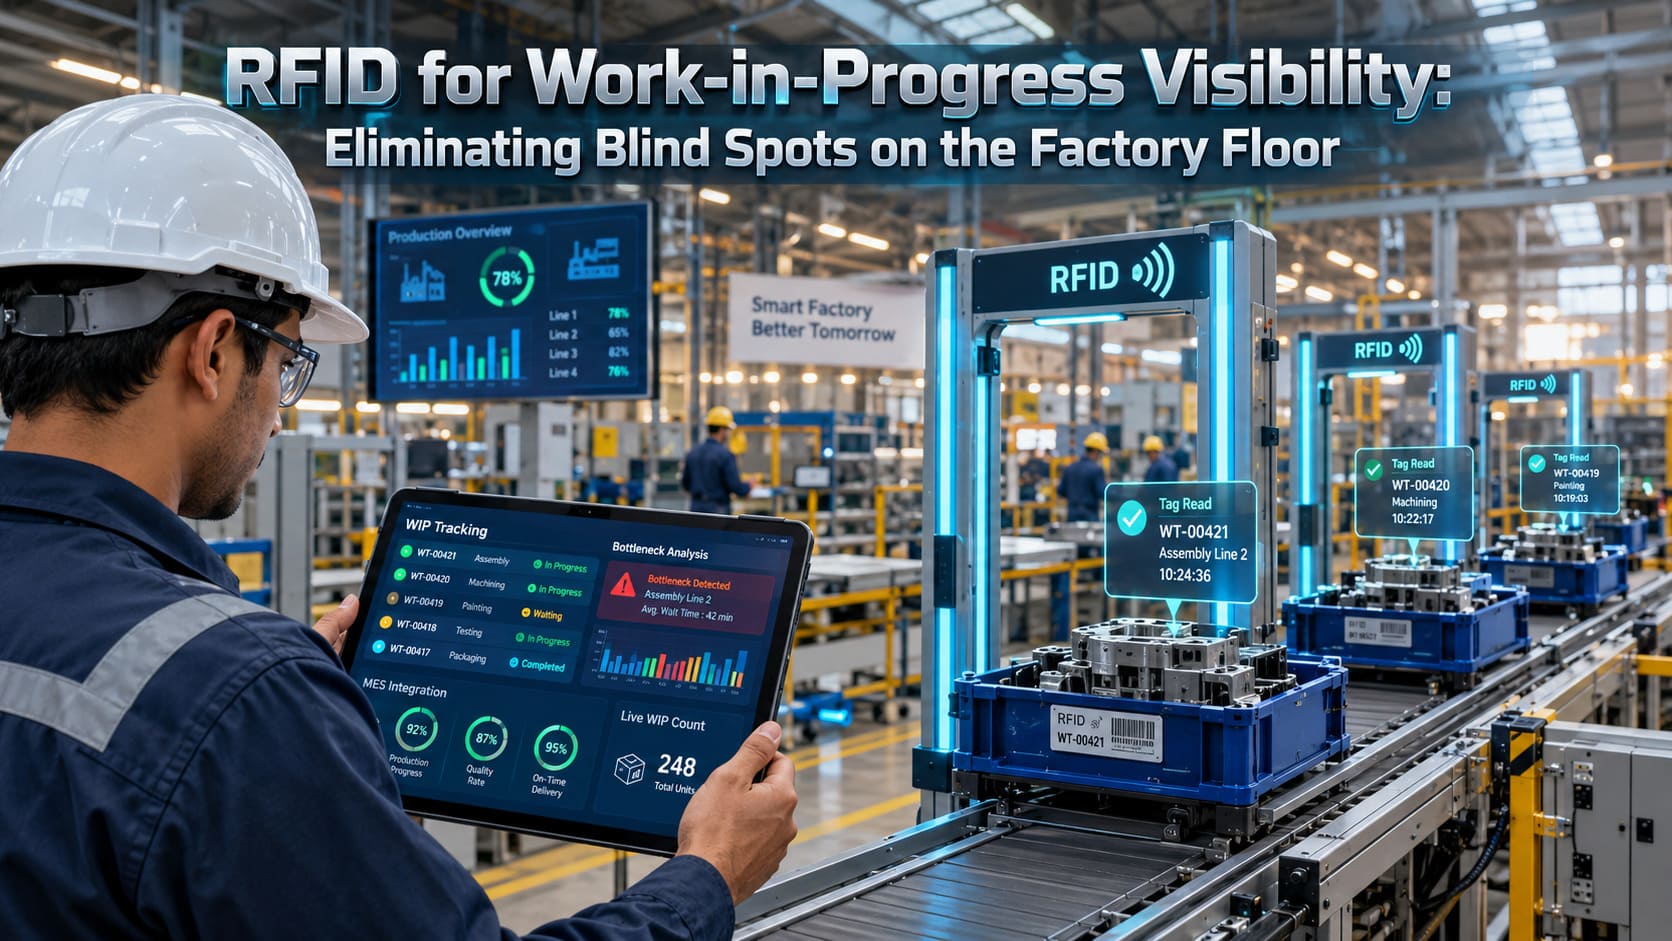
The investment in a Radio-Frequency Identification (RFID) inventory management system is a large-scale strategic investment. The advantages of the operations (99% inventory accuracy, lightning-fast cycle counts, and real-time visibility) are well known, but what is demanded by stakeholders and financial controllers is one thing only: a clear and quantifiable Return on Investment (ROI).
Determining ROI on RFID deployment is not just about the price of tags versus the current salary of labor. It’s a complicated equation of direct labor savings, shrinkage reduction, working capital optimization, and lost sales recovery. Below are the details of how to precisely measure the ROI of your RFID project.
Q1: What are the primary cost categories to include in an RFID ROI calculation?
An accurate ROI can only be done if a complete Total Cost of Ownership (TCO) is calculated first. A lot of companies are trying to succeed only by saving on the tags and hardware and neglecting the running expenses. A thorough cost analysis will address:
- Capital Expenditure (CapEx): This includes initial (up-front) purchasing of the fixed RFID readers, handheld readers, antenna arrays, gateway portals, initial tag inventory, and professional services for installation and infrastructure setup.
- Operating Expenditure (OpEx): These are costs that will continue, such as software licenses, middleware subscriptions, cloud hosting/servers maintenance, periodic hardware replacements, and the cost of RFID tags/label consumables.
- Integration and Professional Services Costs: These are costs associated with custom software development, API integration between the RFID middleware and an existing Enterprise Resource Planning (ERP) or Warehouse Management System (WMS), and training hours for internal personnel.
Q2: How do you quantify labor savings and operational efficiencies in the ROI model?
Labor savings are the most immediate and easily measurable monetary benefit of implementing RFID. In manual barcode- or paper-based environments, workers waste countless hours seeking and locating lost products, doing cycle counts, and scanning products one by one.
Traditional physical inventories involve facility shutdowns and/or significant overtime. Bulk-scanning with RFID makes it possible to count thousands of items within an hour without needing to see them. Determine the number of labour hours saved/week and multiply by the fully loaded hourly rate.
Less Picking and Dwell Times: Order pickers in a distribution centre spend a considerable portion of their time walking and searching. The picking time is significantly reduced with RFID-guided picking. To calculate this, try to calculate the average pick-to-ship cycle time reductions and convert the saved hours into annualized labor savings.
Q3: How do you measure the financial impact of inventory accuracy and reduced shrinkage?
There are two significant hidden costs associated with inventory inaccuracies, known as “ghost stock” and “dead capital. The two significant hidden costs of inventory inaccuracies are “ghost stock” (items that the system believes are on hand but are not) and “dead capital.” RFID increases the level of inventory accuracy from the typical range of 65-75% to 95-99%.
- Shrinkage and Loss Mitigation: Shrinkage (due to theft, administrative mistake, or loss) can affect profit margins. RFID item-level tracking generates a non-modifiable chain of custody, which will discourage internal theft and locate a clear place where it has gone. Determine your shrink rate and then use a conservative rate of 20% to 40% where real-time visibility has been used.
- Working Capital Optimization: To avoid stockouts, businesses end up stocking too much “safety stock” inventory. This uses millions of dollars of working capital. With inventory accuracy reaching near perfection using RFID, you’ll have the freedom to safely lower your safety stock buffers, releasing significant capital that can be invested in other growth initiatives.
Q4: How do you calculate the revenue recovery from eliminating stockouts and false out-of-stocks?
One of the most important (but difficult to measure) aspects is recovery of lost sales, which is likely the best ROI of RFID. If your omnichannel customer or retail shopper wishes to purchase a product but your system mistakenly believes it’s out of stock because of poor stock data, there’s a real possibility that the product sale is gone for good, and your competitor has it.
- To calculate the extent of recovered sales: Analyze the stockout rate and average order size in the past. Determine the percentage of “phantom out-of-stock” shoplifting events, defined as where the merchant knows the product is in the back room, but hasn’t been recorded in the system.
- Calculating Gross Margins: Take the number of units recovered and multiply by the average gross margin per unit. With omnichannel visibility, all inventory is seen, and all inventory is available to be bought; therefore, the top line improves automatically without a need to grow your physical presence.
Q6. How do you quantify error reduction and chargeback/penalty avoidance in the ROI equation?
When major retailers and logistics partners issue harsh penalties for shipping inaccuracies, including lost or misdirected pallets, wrong item counts, or missing compliance labels, it’s a major financial risk. These errors in B2B and Retail Supply Chains result in vendor chargebacks, return processing charges, and emergency transportation freight fees.
Automatically scan outbound shipments at shipping docks: As forklifts move through the portals, RFID automatically scans and verifies cargo with electronic shipping notices (ASN) in real time to eliminate Vendor Chargebacks. Estimate your baseline annual vendor charges and compliance fines, and then apply an 80% – 90% reduction from automation!
Reduce RPO’s: Dealing with returned or wrong orders is much more costly than sales. By lowering the rate of shipping errors, there’s a direct cost-saving effect on the bottom line, as well as a reduction in costs for labor, time spent restocking, and administrative reconciliation of stock.
Conclusion
The ROI calculation of an RFID inventory management system is not just about the number of barcodes. With the inclusion of hard labour savings, shrinkage reduction, optimized working capital, and recovered retail sales, organisations can create a financial business case that is bulletproof for digital transformation.
FAQs
- How long does it typically take for an RFID system to achieve a positive ROI?
A well-designed RFID system pays for itself in 12 to 24 months for most retail, warehousing, and manufacturing applications. Depending on the size of the deployment and the existing level of inefficiencies in labor, the exact period may vary.
- Is it better to calculate RFID ROI based on labor savings alone?
No. It’s easy to measure labor savings, but if your ROI calculation only considers labor, you’re missing out on the huge returns that can be realized from working capital reductions, inventory accuracy, and the recovery of lost sales from eliminated stockouts.
- How do consumable tag costs factor into the long-term ROI equation?
Tag costs are ongoing operating costs. If you are trying to calculate the ROI in the long term, you need to look at the number of units that you will be selling each year and multiply that by the cost of each tag, making sure that the savings in labor and accuracy far exceed the cost of tags.
- What is the biggest mistake companies make when calculating RFID ROI?
The most frequently made error is too low an estimate for integration and software middleware expense and too high an estimate for short-term labor savings. Taking a conservative, phased approach for costs AND benefits will give a realistic and defensible ROI model.